Your agent can't read a flamegraph. Here's what it can read instead
The React DevTools Profiler draws one sidebar click as colored bars for a human. Genie returns the same click as text that names the cause, and verify proves the fix.
Your coding agent can't look at a React Profiler flamegraph and see which bar matters. Genie gives it the same commit as text: which components rendered, whether each render was needed, and what caused it. For one click on a React 19.3.1 dashboard, the Profiler showed the stat cards re-rendering. Genie counted four of them and named the cause, two callbacks that a context provider recreates on every render.
The Profiler and Genie first recorded the same click in the same page, at the same time. The Genie steps were then re-run on Genie 1.1.0 in the unchanged app, and the Genie output below comes from that re-run. The evidence file has every command and the full output.
Collapsing the sidebar re-renders the dashboard cards
The app is apps/realworld-dashboard, an operations console in this repo. On its Dashboard page, clicking Collapse sidebar re-renders the four memoized StatCards, even though their data did not change. The app ships with this bug on purpose. The answer key is evals/realworld/dashboard/dashboard-sidebar-rerenders-cards.json.
I added the script tag for the standalone React DevTools 8.0.0 to a copy of the app and left Genie in place. I drove the Profiler's buttons from a script over the Chrome DevTools Protocol, and agent-browser clicked the app.
What the Profiler shows a human
With default settings, the Profiler recorded one commit:
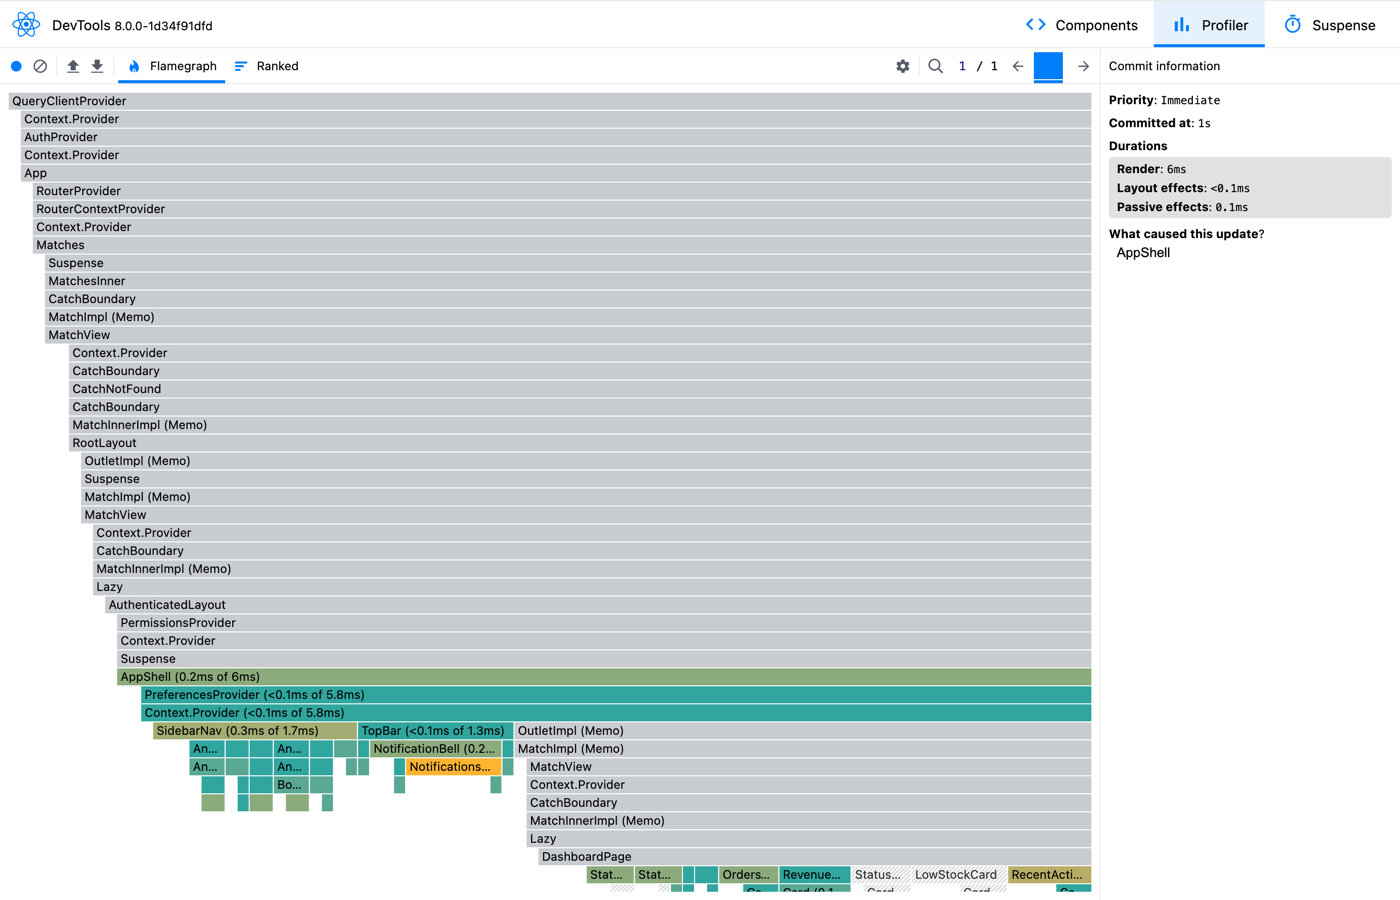
A human reads it in a few seconds. The commit took 6 ms to render. The update started in AppShell. Under it, PreferencesProvider, SidebarNav, TopBar and the dashboard cards are colored, so they rendered. Gray bars did not. Clicking a StatCard bar shows when it rendered and for how long:
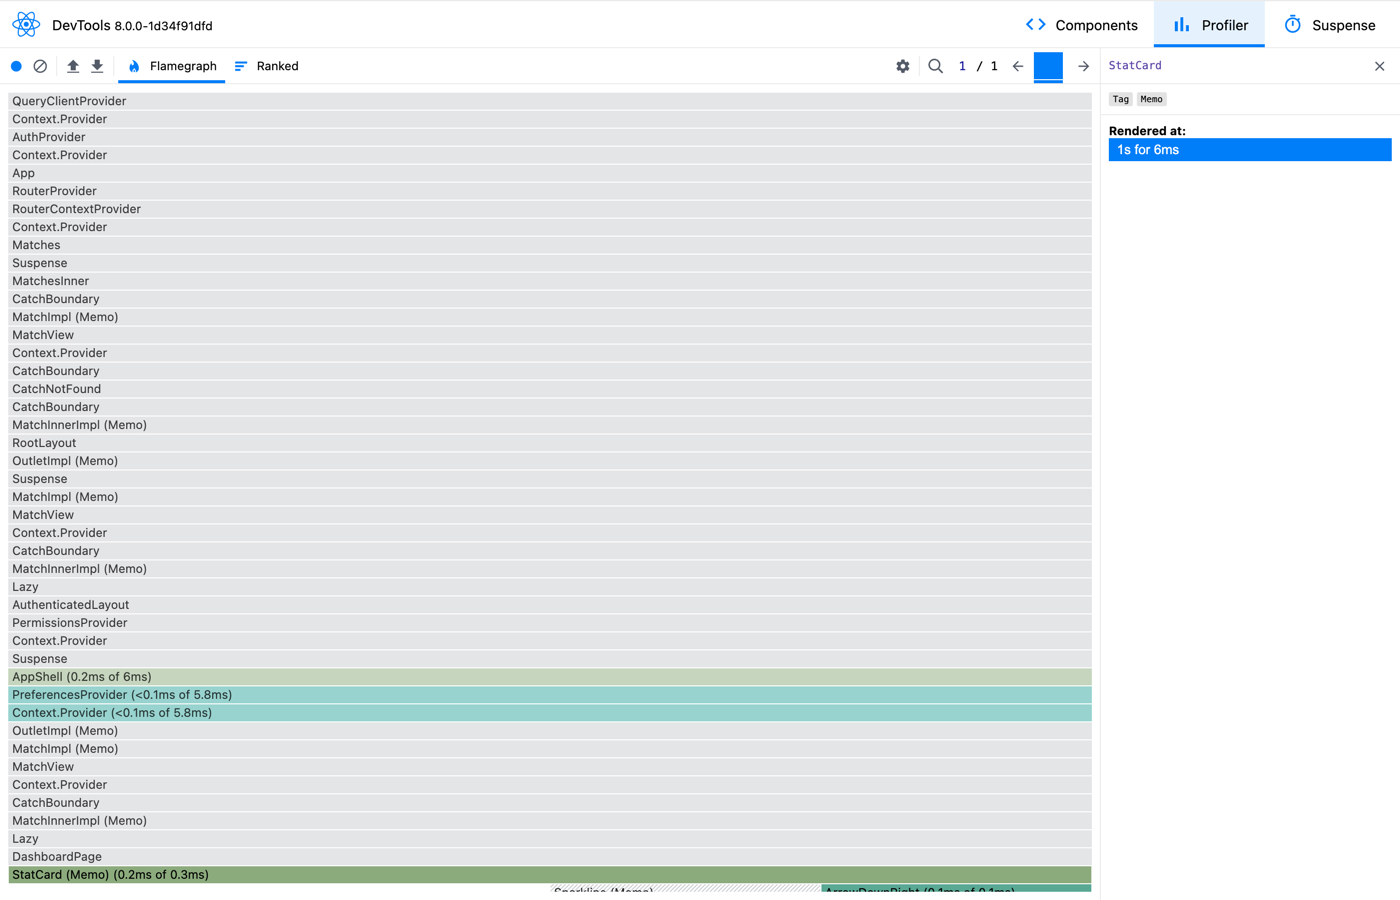
The side panel says Rendered at: 1s for 6ms. It does not say why. The Profiler can record that, but only with Record why each component rendered while profiling turned on in its settings. It was off by default.
With that setting on, I recorded the same click twice. Both times the Profiler showed "No profiling data has been recorded":
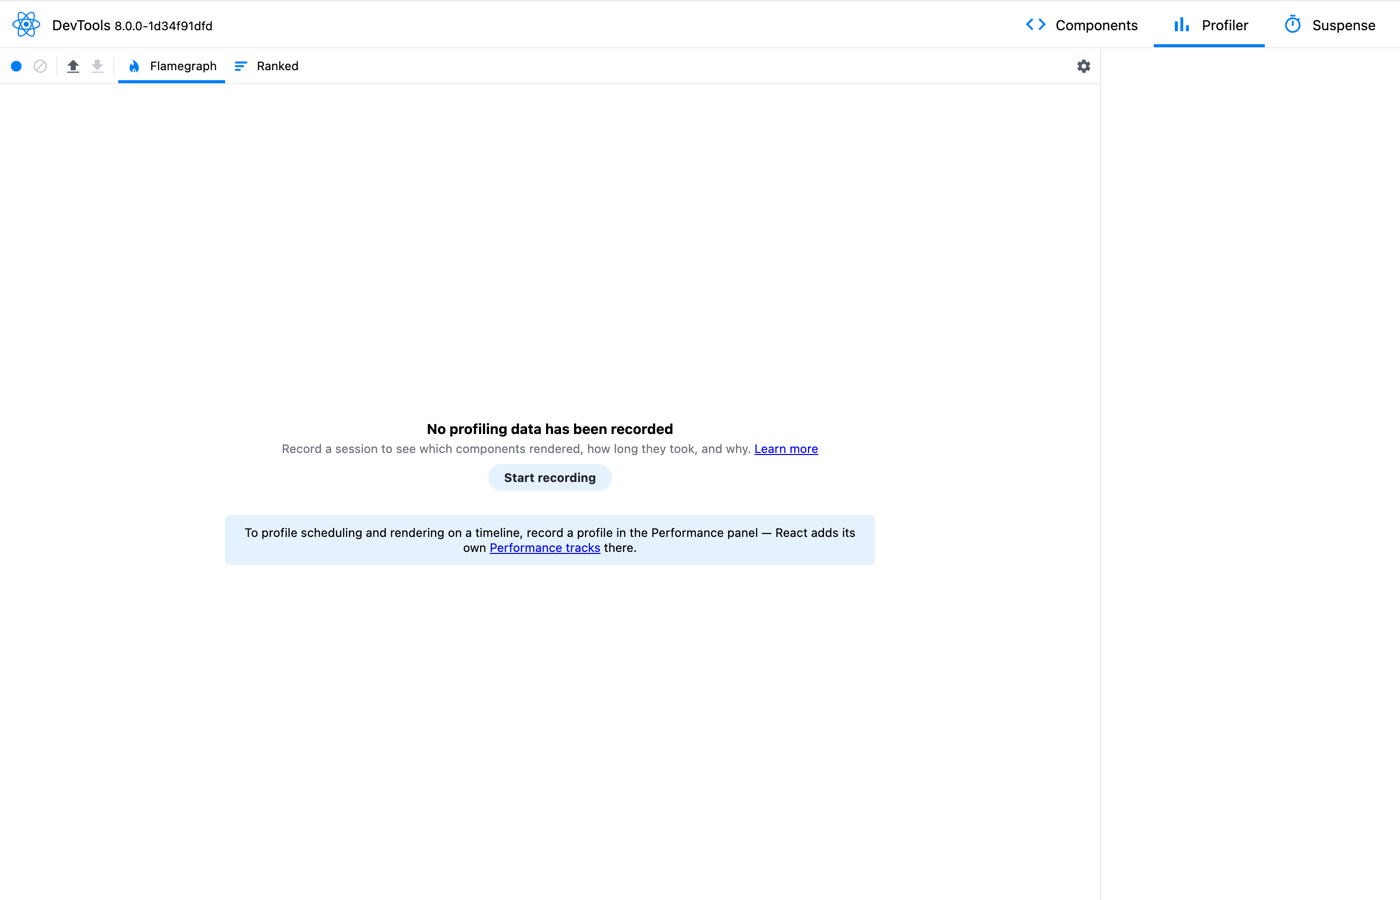
Each recording logged this error in the page console. It came from the DevTools backend script:
Error: Unknown Fiber. Needs to be a function component to inspect hooks.
    at inspectHooksOfFiberImpl (http://localhost:8298/:651:70)
    at __webpack_modules__.786.exports.inspectHooksOfFiber (http://localhost:8298/:705:10)
    at inspectHooks (http://localhost:8298/:11323:55)
    at getChangeDescription (http://localhost:8298/:8813:27)
    at recordProfilingDurations (http://localhost:8298/:10271:37)
The same error appeared in a copy of the app with no Genie code in it, so Genie did not cause it. I tested only this app. Other apps may record "why" without trouble.
An agent can press those buttons, as my script did. What comes back is pixels, or DOM labels such as StatCard (Memo) (0.2ms of 0.3ms). The cause is not in either.
What Genie gives the agent
Genie records the same click. The agent opens a window, clicks, waits for React to go idle, and asks what rendered:
npx genie-react call react_clear_renders '{}' --session upd-g
agent-browser --session upd-g click @e177
npx genie-react call react_quiesce '{"idleMs":500,"timeoutMs":10000}' --fail-on-result-error --session upd-g
npx genie-react call react_get_renders '{"sort":"renders","limit":80,"appOnly":true}' --session upd-g --fields name,renders,necessity,necessityReason
react_quiesce reported observedCommits: 0, because the click's commit landed before the wait started. Its renderWindow field, {…,commits:1}, shows that the window holds that commit.
The result lists 35 app components that rendered once each. Genie 1.0.2 also listed six TanStack Router Link elements here under the name sidebar-nav.tsx, and 1.1.0 hides them as library components. Trimmed to selected rows:
[35]:
  each: {renders:1}
  - {name:AppShell,necessity:necessary,necessityReason:dom-changed}
  - {name:PreferencesProvider,necessity:necessary,necessityReason:dom-changed}
  - {name:SidebarNav,necessity:necessary,necessityReason:dom-changed}
  - {name:TopBar,necessity:unnecessary,necessityReason:inputs-unchanged}
  - {name:StatCard,necessity:unnecessary,necessityReason:output-unchanged}
  - {name:StatCard,necessity:unnecessary,necessityReason:output-unchanged}
  - {name:StatCard,necessity:unnecessary,necessityReason:output-unchanged}
  - {name:StatCard,necessity:unnecessary,necessityReason:output-unchanged}
unnecessary tells the agent that the four cards rendered and changed nothing. Next, the cause:
npx genie-react call react_render_causes '{"component":"StatCard","limit":1}' --session upd-gStatCard #813913080036 {…,necessity:unnecessary,necessityReason:output-unchanged,inputEvidence:incomplete,…,source:{location:/src/features/dashboard/dashboard-page.tsx:55:9,…}}
← context exact "Context(PreferencesProvider)" {contextIndex:0}The context from PreferencesProvider changed, and the grade is exact. With "view":"full", the cause carries a diff of the context value. From --json, trimmed to the diff:
{
  "deepDiff": {
    "changes": [
      { "kind": "identity-changed-uninspected", "path": "/setTheme" },
      { "kind": "identity-changed-uninspected", "path": "/setLocale" }
    ],
    "visited": 13,
    "truncated": true
  }
}
The diff lists only the two callbacks. Each got a new function on this render. Asked about PreferencesProvider, Genie reported {kind:parent,evidence:inferred,name:AppShell}. That matches the Profiler's "What caused this update? AppShell".
Genie also marked the answer as partial. Its coverage said semantics: lower-bound, with reason inputs-truncated, because the cards' inputs held functions that it compares only in part. The exact context cause stands, but the list of causes may be incomplete.
The cause
PreferencesProvider sits inside AppShell. Collapsing the sidebar changes AppShell state, which re-renders the provider. The provider builds setTheme, setLocale and its value object inline, so each render passes a new context value. Every usePreferences consumer re-renders, including the memoized cards.
The fix
-  const setTheme = (next: Theme) => {
+  const setTheme = useCallback((next: Theme) => {
     window.localStorage.setItem(THEME_KEY, next)
     setThemeState(next)
-  }
-  const setLocale = (next: Locale) => {
+  }, [])
+  const setLocale = useCallback((next: Locale) => {
     window.localStorage.setItem(LOCALE_KEY, next)
     setLocaleState(next)
-  }
+  }, [])

-  const value: PreferencesContextValue = {
-    ...formatters,
-    theme,
-    resolvedTheme,
-    locale,
-    setTheme,
-    setLocale,
-  }
+  const value = useMemo<PreferencesContextValue>(
+    () => ({ ...formatters, theme, resolvedTheme, locale, setTheme, setLocale }),
+    [formatters, theme, resolvedTheme, locale, setTheme, setLocale],
+  )
The import line also gains useCallback.
The proof
A flamegraph before and after would need a human to compare the colors. verify states the result as claims and an exit code. I ran it on the unchanged app, before the fix:
npx genie-react verify begin --session upd-g --name "collapse sidebar" \
  --claim 'render StatCard max 0' --claim 'render SidebarNav min 1'
agent-browser --session upd-g click @e198
npx genie-react verify end vfy_97e052d8-87d3-4d33-b298-f4c3ca50ece7 --session upd-gfail vfy_97e052d8-87d3-4d33-b298-f4c3ca50ece7 "collapse sidebar" 1 commit, quiet after 752 ms (react, query, router, network)
1 fail render StatCard max 0 {renders:4,mounts:0,updates:4,remounts:0,semantics:exact,instances:4,activeInstances:4}
2 pass render SidebarNav min 1 {renders:1,mounts:0,updates:1,remounts:0,semantics:exact,instances:1,activeInstances:1}The command exited 1. After the fix, the same claims and the same click:
pass vfy_08be3534-53d2-44a9-bd18-09a5ccddc0cf "collapse sidebar"  1 commit, quiet after 2314 ms (react, query, router, network)
  1 pass render StatCard max 0  {renders:0,mounts:0,updates:0,remounts:0,semantics:exact,instances:4,activeInstances:4}
  2 pass render SidebarNav min 1  {renders:1,mounts:0,updates:1,remounts:0,semantics:exact,instances:1,activeInstances:1}
The command exited 0. SidebarNav min 1 proves the click reached the app. Without it, a click that missed would also pass StatCard max 0. See Verify a fix for the claim forms.
When a human with the Profiler is the better path
Use the Profiler when you don't yet know what you are looking for. One flamegraph shows the shape of a whole commit, and bar widths show where the time went. With Genie, the agent asks one question at a time and needs a component name or a sort order to start.
Use it when timing is the question. The Profiler shows render, layout effect and passive effect durations per commit. The Profiler itself points to the browser Performance panel for scheduling, where React adds its own tracks. Genie's optimize guide compares repeated captures, and its evidence rules warn that development timings do not predict production.
Use Genie when an agent has to act on the answer. The agent gets a cause it can trace to a line of code, and a verdict with an exit code. Genie does not check the screen, so the agent still confirms the UI with agent-browser.
Genie vs agent-react-devtools: one named the re-render, the other reported 291 first mounts
Both tools give your coding agent React DevTools data as text. On the same React 19 bug, Genie named the cause and proved the fix, and agent-react-devtools' profile went wrong.
Playwright MCP sees the screen. It can't see why React re-rendered
Ticking one checkbox re-rendered all 100 table rows. The driver's checkbox state, console and network log read the same before and after the fix. Genie named the prop and exited 1, then 0.